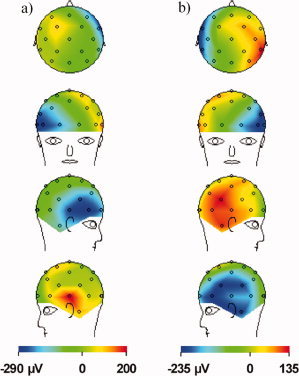
Figure 5.

In vivo spatial voltage map of the BCG artefact measured for a human subject in the 3 T static magnetic field of a Philips Achieva MR Scanner, with the main magnetic field pointing in the head to foot direction. The artefacts are sampled at the two amplitude maxima shown in Figure 4 that follow each ECG R‐peak, with: (a) the first peak at ∼170 ms following the R‐peak and (b) the second peak at ∼260 ms. Note the left/right change in polarity between the maps formed at the two peaks. [Color figure can be viewed in the online issue, which is available at www.interscience.wiley.com.]
