
Figure 6.
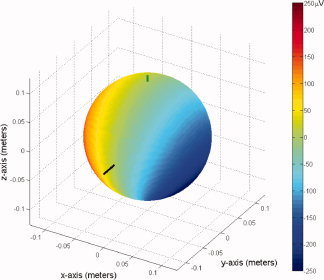
Analytic simulation of the artifacts generated by a forward nod of the head of angular velocity 0.44°/s for a 19‐cm diameter sphere, as predicted from a least‐squares fit to the in vivo BCG at the second peak. The long bar indicates the position of the nasion and the smaller bar marks the pole of the sphere, where the simulated “reference” electrode and cable tree are placed. [Color figure can be viewed in the online issue, which is available at www.interscience.wiley.com.]