
Figure 9.
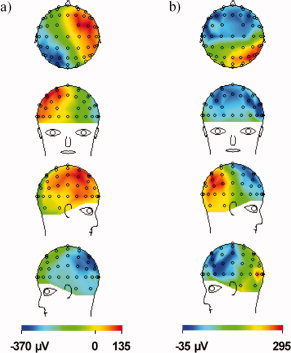
Spatial maps of EEG data for conductive fluid flowing through an approximately U‐shaped conduit inside a conductive spherical agar phantom. The measurement was conducted for continuous flow in the anterior‐to‐posterior (a) and right‐to‐left (b) directions and sampled 5 s after flow onset to avoid movement artefacts. [Color figure can be viewed in the online issue, which is available at www.interscience.wiley.com.]