
Figure 1.
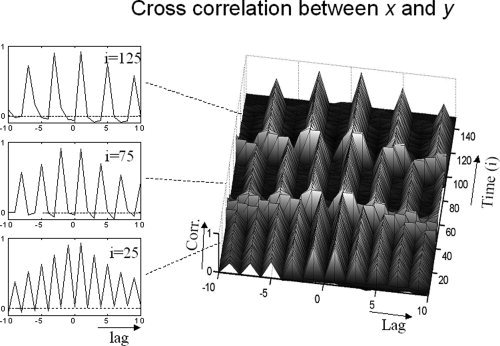
Left: Cross correlation between the simulated data sets (x and y, see methods section) at selected time points (see index) for a lag (delay) of ±10 sampling intervals. Right: Comprehensive overview for the whole period.
Official websites use .gov
A
.gov website belongs to an official
government organization in the United States.
Secure .gov websites use HTTPS
A lock (
) or https:// means you've safely
connected to the .gov website. Share sensitive
information only on official, secure websites.
Left: Cross correlation between the simulated data sets (x and y, see methods section) at selected time points (see index) for a lag (delay) of ±10 sampling intervals. Right: Comprehensive overview for the whole period.