
Figure 5.
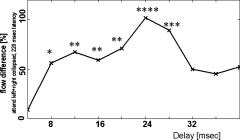
Excess of cumulated information flow towards striate areas (see Fig. 4 for the normalization) at various delays of interaction between contralateral extrastriate (ES) and striate (S) areas under the “attend” condition. The curve was derived at a latency of 220 ms where the cumulated difference flow between ES and S is largest under the “attend” condition. Levels of significance: “*” = P < 0.05, “**” = P < 0.01, “***” = P < 0.005, “****” = P < 0.001.