
Figure 2.
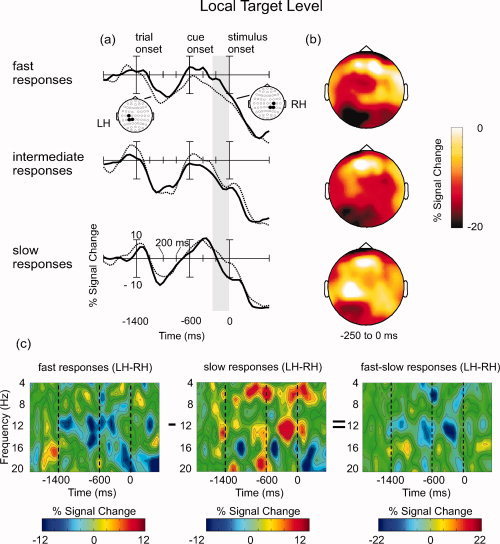
Oscillatory brain activity in the preparation for local target levels, contingent on the behavioral performance (fast, intermediate and slow responses). (a) Waveforms depicting percentaged signal change within the alpha band (8–12 Hz) at centro‐parietal electrodes in the left hemisphere (LH) and in the right hemisphere (RH). The gray vertical column signifies the epoch that yielded the most pronounced differences between hemispheres (−250 to 0 ms). Statistics were performed on the mean amplitudes within this time window. (b) Scalp topographies of percentaged signal change within the alpha band (8–12 Hz), averaged between −250 and 0 ms relative to the stimulus onset. Notice that the scale is unipolar from −20 to 0. (c) Time–frequency plots showing hemispheric differences in the alpha frequency range at centro‐parietal electrodes for fast vs. slow response trials (see text for details).