
Figure 2.
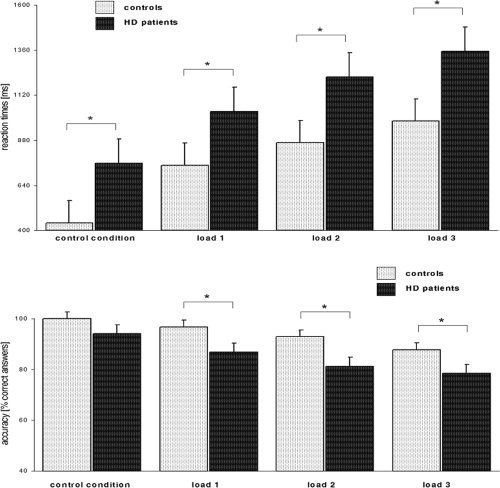
Behavioral performance during the fMRI task. Upper Panel: Average reaction times across all load levels (±standard error), shown for healthy controls and HD patients. Lower Panel: Average accuracy (±standard error) across all load levels. * indicates significant differences at P < 0.05.