
Figure 4.
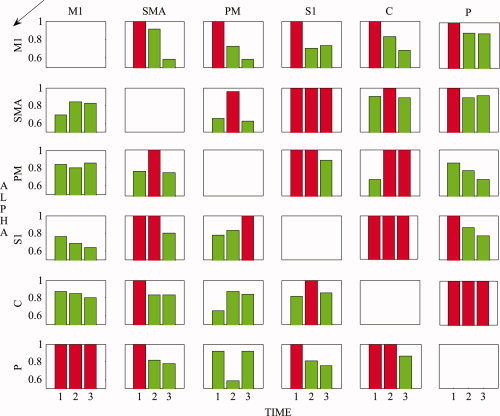
The temporal variation of significance value α (α = 1−P) for all possible connections between the ROIs. The direction of influence, as indicated by the black arrow, is from the columns to the rows. The red bars indicate the connections that passed the significance threshold of α = 0.95 and the green ones that did not. [Color figure can be viewed in the online issue, which is available at www.interscience.wiley.com.]