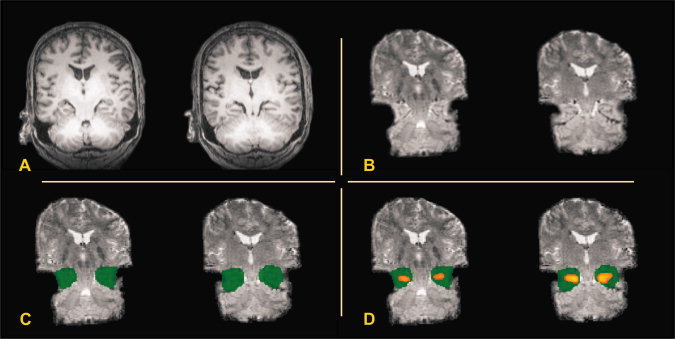
Figure 1.

Example of delineation of individual nonnormalized ROIs on nonnormalized functional EPI images. Two adjacent coronal slices are shown (Patient GR) in radiological convention. (A) Anatomical images, (B) interpolated nonnormalized functional images, (C) nonnormalized functional images with individual ROIs (not interpolated), and (D) Same as (C) but with MTL activation overlaid (thresholded ROI analysis).
