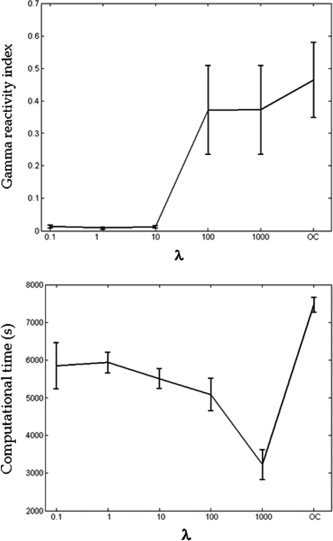
Figure 1.

(a) Error bars (mean ± 2*standard error) of the percentage (%) of source maps in the area of interest across subjects for each method; (b) Bars representing the mean +2*standard error of the spatial frequency‐related gamma reactivity index of the selected sources across subjects for each method. This index being the relative normalized variation between Stimulus and No‐Stimulus power spectral density (computed separately for each SF), the y‐axis scale units are not shown.
