
Figure A1.
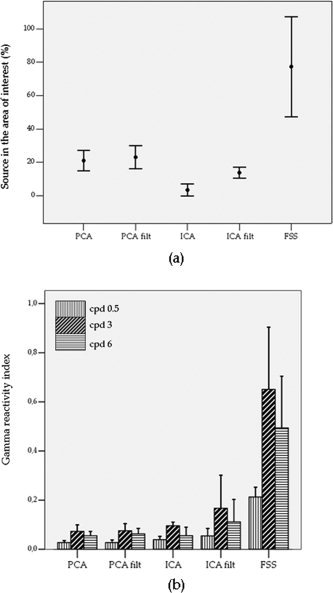
Means and standard errors of the gamma reactivity index across subjects for the tested λ values; this index being a relative normalized variation between Stimulus and No‐Stimulus power spectral density, the y‐axis scale units are not reported (top). Means and standard errors of the computational times in seconds (scale units of the y‐axis) for the first FS extractions (bottom).