
Figure 2.
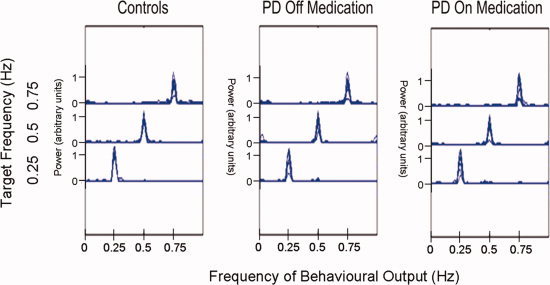
Summary of the behavioral data. Power spectrum of the behavioral output for each subject is overlaid with each of the three task frequencies displayed as a separate curve. The frequencies at which the power spectrum of the squeeze output peaked correspond to the target frequencies. Task performance of controls and PD off and on medication were similar with no significant group differences detected in the error rates (F(2,166) = 1.56, P = 0.2132). [Color figure can be viewed in the online issue, which is available at www.interscience.wiley.com.]