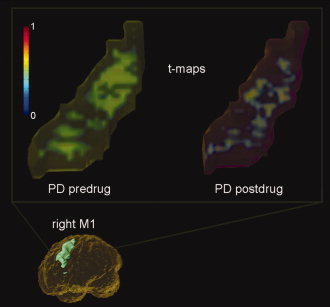
Figure 3.

Focusing effect of l‐dopa seen in a typical PD subject. The t‐maps shown (right M1) include all voxels with positive t values normalized between [0,1] to emphasize the spatial distribution changes. (top left) A much wider recruitment of the ROI was required to perform the same motor task prior to medication. (top right) The ROI activation pattern appears to focus upon medication. [Color figure can be viewed in the online issue, which is available at www.interscience.wiley.com.]
