
Figure 4.
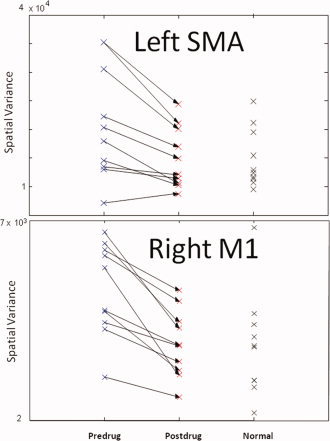
Normalization of the spatial variance of activation within an ROI by l‐dopa. (top panel) The spatial variance of a region demonstrating a significant effect of l‐dopa (the left SMA) is plotted. The arrows represent the effects of l‐dopa on the spatial variance of each PD subject. The feature values for the normal subjects are shown for comparison. (bottom panel) Normalization of spatial variance in a region ipsilateral to the movement (right primary motor cortex, M1). l‐dopa appears to refocus the activation of M1 in PD with the resultant spatial extent becoming more similar to that of the controls. [Color figure can be viewed in the online issue, which is available at www.interscience.wiley.com.]