
Figure 2.
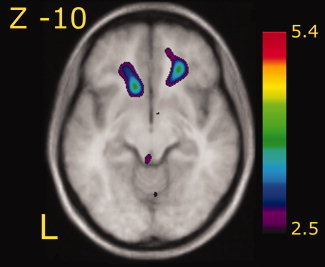
A statistical parametric map (t statistics as represented by the color scale) showing group averaged rCBF response to the processing of the odor control [contrast odor control vs. baseline] superimposed on group averaged anatomical MRI. Significant increase of rCBF is seen bilaterally in the orbitofrontal cortex (x, y, z: −13, 22, −14; t = 3.68 and 23, 34, −8; t = 3.81). Coordinates in figure and figure legend denotes slice and peak activations expressed according to the MNI coordinates system. Left in figure represents left side (L).