
Figure 2.
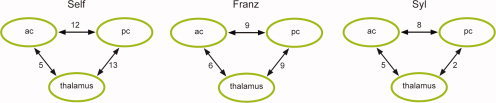
Synchronization between individual paralimbic regions. Increase in synchronization indices between each set of two of the three paralimbic regions in each of the three conditions (P < 0.001 for all values). The numbers close to the arrows indicate percent increase in synchronization in each set of two regions connected by the arrow (means of 12 subjects) to illustrate the effect of stimulus presentation on neural synchrony. Normalization to percent increase are chosen to facilitate comparisons of synchronization effects. [Color figure can be viewed in the online issue, which is available at www.interscience.wiley.com.]