
Figure 4.
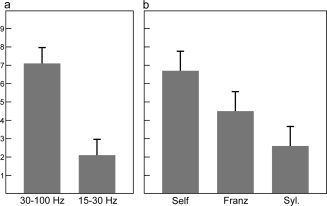
Increase in synchronization index during conscious experience depends on frequency band and condition. Figure 4 shows results from ANOVA analysis of population marginal means, i.e., means after removing the main effects of all other factors in the ANOVA model. The ANOVA factors frequency and condition are computed with multicompare function in Matlab (Mathworks). (a) SI increases (%, error bars: standard error of the mean) predominantly in gamma band (P = 0.0001, ANOVA). (b) SI increases (%, error bars: standard errors of the mean) in all conditions. The increase depends on the degree of self‐reference (Self > Franz > Syl; P = 0.028, ANOVA).