
Figure 3.
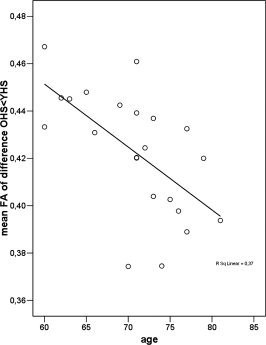
Correlations between FA integrity and age. Scatter plot of the correlation between mean FA within the WM areas affected by aging and age within the older healthy controls. A significant inverse correlation (ρ = −0.66, P = 0.0004) was observed, i.e. older age was related to lower mean FA.