
Figure 3.
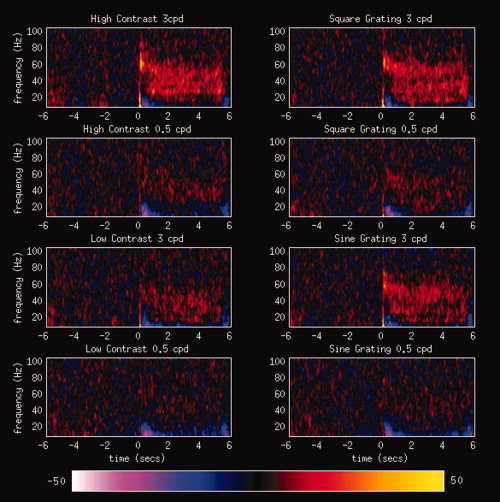
Grand‐averaged time‐frequency spectrograms from MEG virtual sensors constructed in peak locations in primary visual cortex. Virtual sensors were generated from the peak gamma‐band location in primary visual cortex for each condition. Energy values are represented as a percentage change from the baseline energy. The sustained nature of gamma‐band activity during visual stimulation (0–5 s) can be seen in these spectrograms. [Color figure can be viewed in the online issue, which is available at www.interscience.wiley.com.]