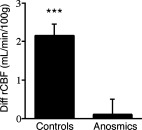
Figure 2.

Volume of interest analysis of the rCBF in the anterior hypothalamus. There was a significant group × compound interaction (F = 16.3, P = 0.0002). The figure illustrates changes in rCBF in controls and anosmics for EST–AIR, which constituted the group difference. Mean and SD are given. ***P < 0.001.
