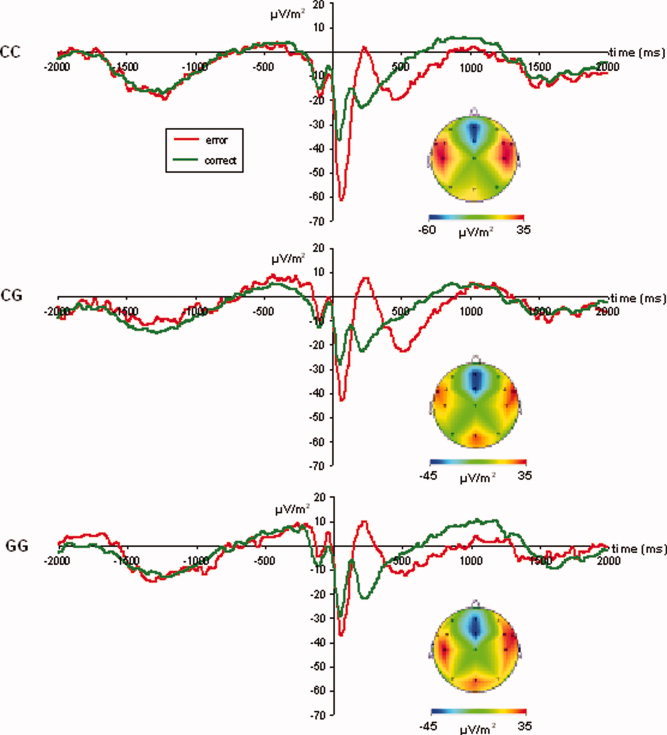
Figure 1.

Response‐locked ERPs at electrode Fz. Green lines denote the ERP on correct trials, red lines denote the ERPs on error trials. The 5‐HT1A C(−1019)G genotype groups are plotted seperately. As can be seen, the Ne on was considerably larger in the CC genotype group than the other genotype groups. The Nc was comparably large in the different genotype groups. The CSD maps given for each genotype group denote a clear Ne‐topography, with negativities confined to electrodes Fz and FCz. [Color figure can be viewed in the online issue, which is available at www.interscience.wiley.com.]
