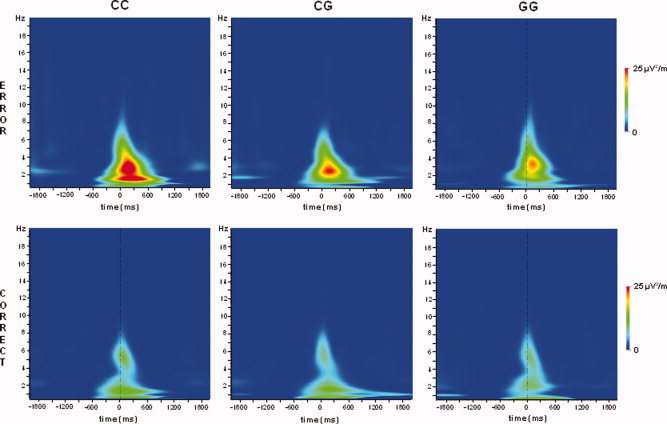
Figure 2.

Time‐frequency plots on error (top row) and correct trials (bottom row), separated for the 5‐HT1A C(−1019)G genotype groups. The abscissa denotes the time scale in ms; time point 0 denotes the response. The ordinate denotes the frequency from 1 to 19 Hz. The power at each time point within the frequency range is color‐coded. As can be seen, the wavelet power is similar for correct responses. On error responses, the wavelet power is higher is increased in all genotype groups, relative to correct responses, but considerably more in the CC genotype group. [Color figure can be viewed in the online issue, which is available at www.interscience.wiley.com.]
