
Figure 5.
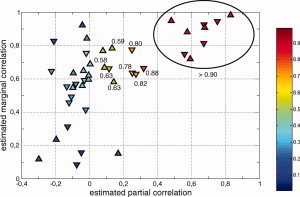
Correlation classification. Each link is indexed by its estimated partial (x‐axis) and marginal (y‐axis) correlation. Up and down arrows relate to links that correspond to the task and control conditions, respectively. The color codes the probability P for a given link to be included in the set of relevant links. The probability values have been added for links with P > 0.5. We used an ellipse to gather all links with a probability larger than 0.9.