
Figure 4.
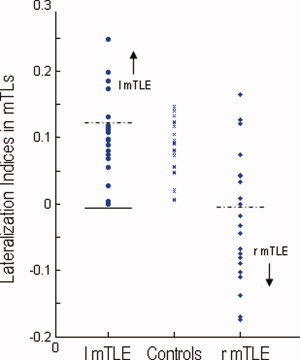
Lateralization indices (LIs) for ALFF within mTLs across three different groups. The horizontal lines indicate the cutoff points where each group of patients and healthy controls are correctly categorized. The solid lines indicate the cutoff points (−0.01) for differentiating between the patient groups, and the dashed lines indicate the cutoff points (0.12 for left mTLE and −0.01 for right mTLE) for differentiating the patients from the controls. A sensitivity of 0.55 and a specificity of 0.44 are yielded for differentiating the left mTLE patients from the healthy controls, and a moderate sensitivity of 0.71 and a high specificity of 1.0 for differentiating the left mTLE patients from the right mTLE patients (which can be swapped between the two patient groups). Whereas, a moderate sensitivity of 0.76 and a high specificity of 1.0 can be yielded for differentiating the right mTLE patients from the controls. [Color figure can be viewed in the online issue, which is available at wileyonlinelibrary.com.]