
Figure 5.
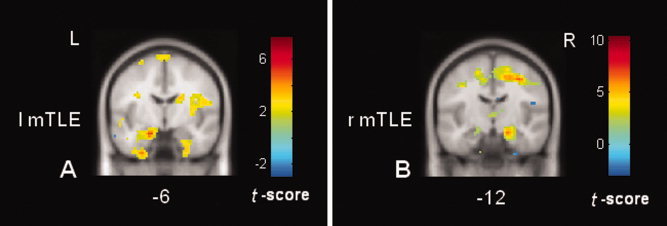
Examples of the individual SPM results by comparing each single patient to the control group. (A) The result of a left mTLE patient; and (B) the result of a right mTLE patient. The mTLs ipsilateral to the epileptogenic sides consistently show the increases in ALFF. [Color figure can be viewed in the online issue, which is available at wileyonlinelibrary.com.]