
Figure 1.
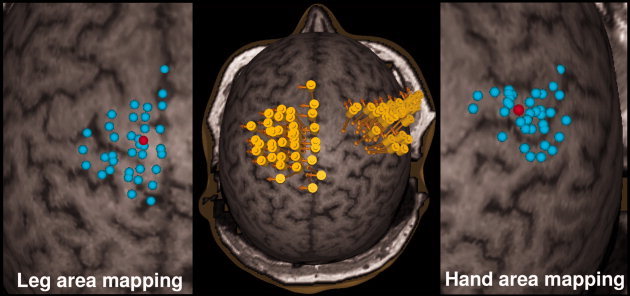
The primary motor cortex and the surrounding areas were thoroughly mapped for thenar (hand) and anterior tibial (leg) muscle representation areas. The middle image shows the cortical stimulation areas with individual stimuli for leg and hand areas. The yellow cylinders represent the location of the coil during stimulation. The direction of the induced electrical current is illustrated with orange arrows. Stimulation foci are shown in the close‐ups for both areas (leg on the left and hand on the right). Red dots represent the optimal stimulation sites inducing the highest MEP response.