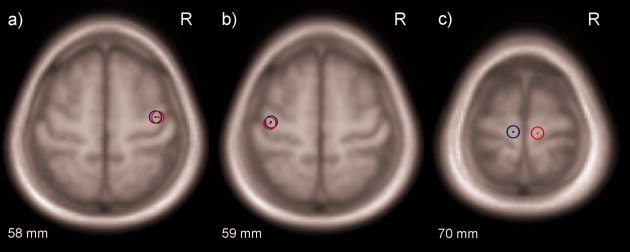
Figure 3.

The centres of masses of the normalized optimal stimulation sites for (a) left thenar muscle (biphasic pulse form in red and monophasic in blue), b) right thenar muscle (biphasic pulse form in red and monophasic in blue), and c) right (blue) and left (red) anterior tibial muscle.
