
Figure 1.
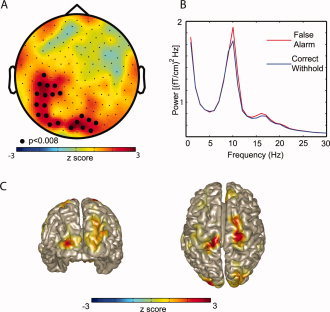
The power calculated in prestimulus interval (time −1 to 0 s) for False Alarms compared to Correct Withholds. (A) Topography of the 10–11 Hz power of the difference between False Alarms and Correct Withholds averaged over subjects (planar gradient). The cluster of sensors showing significantly stronger alpha power for False Alarms than Correct Withholds is marked with dots (P < 0.008; cluster randomization routine). (B) Grand average of the spectra calculated (−1 to 0 s; red line, False Alarms; blue line, Correct Withholds). The spectra were averaged over the cluster of sensors that showed a significant difference. (C) Using a beamforming approach we identified the regions accounting for the difference in alpha power between False Alarms and Correct Rejections to occipital and sensorimotor cortex.