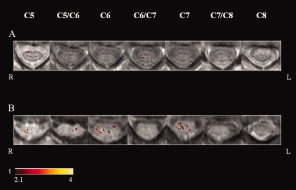
Figure 1.

Illustrative activation maps (color coded for t values) of cervical cord superimposed on axial proton TSEs images from C5 to C8, from two healthy subjects (A and B) during a tactile stimulation of the palm of their right hands. Right (R) and left (L).
