
Figure 3.
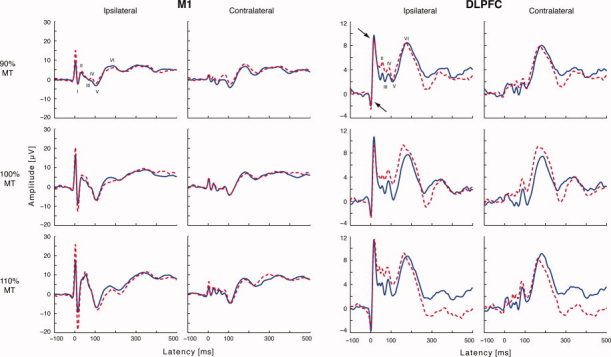
Grand average waveforms of the two measurements from ROI electrodes after primary motor (M1) and dorsolateral prefrontal cortex (DLPFC) stimulation. Dashed line illustrates the first and the solid line the second recording. The arrows indicate the residual TMS artefact. The signals were low‐pass filtered with a cut‐off frequency of 45 Hz. Note different amplitude scales for M1 and DLPFC responses. Variability of response peaks is larger than the baseline noise. [Color figure can be viewed in the online issue, which is available at www.interscience.wiley.com.]