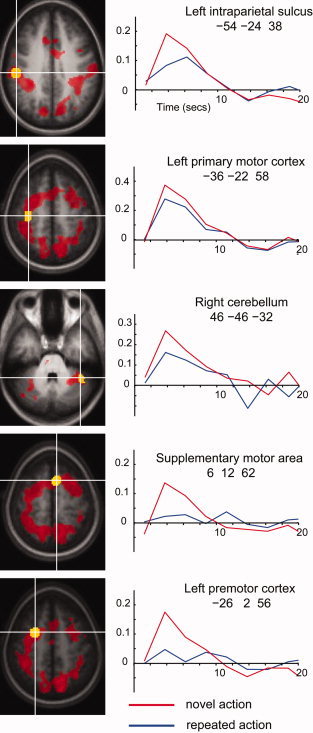
Figure 2.

RS in specific clusters. Post‐stimulus time histograms are shown for five clusters. In each case, data was extracted from the yellow region to generate the plot. Red blobs on the brain slices illustrate all regions involved in the novel action > repeated action contrast. [Color figure can be viewed in the online issue, which is available at www.interscience.wiley.com.]
