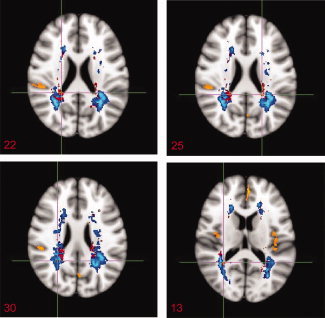
Figure 3.

Overlay map of significant T2 lesion volume increases (red) in the PLV group of patients (n = 45) on a lesion probability map at baseline (LPM, blue) and GM volume changes (orange). [Color figure can be viewed in the online issue, which is available at wileyonlinelibrary.com.]
