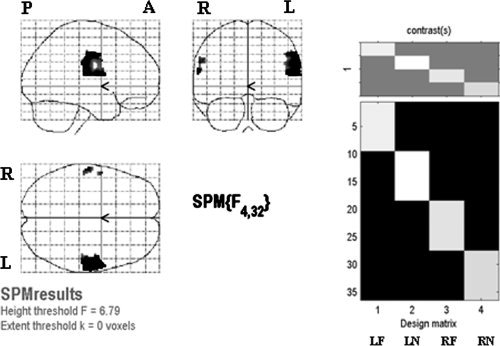
Figure 3.

Left: results of one‐way ANOVA for effects‐of‐interest F contrast of four stimulation locations, with thresholded P < 0.05 and FWE corrected. Right: design matrix. Each column in the design matrix represents one stimulation location and contains data of nine subjects. One‐way ANOVA was performed to test the difference among the four columns.
