
Figure 4.
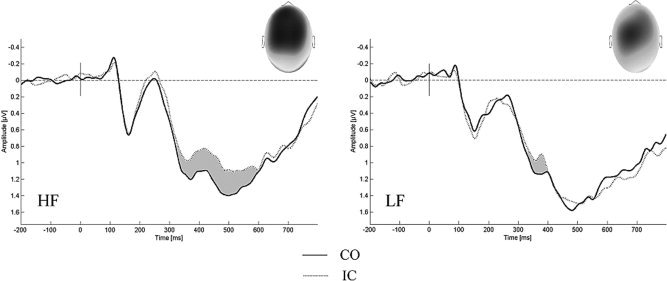
Fronto‐central interference effect between 320 and 600 ms. ERPs to congruent (CO) and incongruent (IC) stimuli aggregated over fronto‐central electrodes (Cz, C1, C2, FCz, FC1, FC2). Note the more pronounced or prolonged differentiation seen in high fissured (HF) as compared to low fissured (LF) subjects. The topography of the difference wave for the relevant time windows (gray) can be seen in the upper right corner; dark colors indicate negativity whereas bright colors indicate positive amplitudes. Observable as well is a global offset between groups, with more positive going waves for LF as compared to HF subjects, starting to develop at about 400 ms (refer to Fig. 5 for the topography of the difference wave).