
Figure 6.
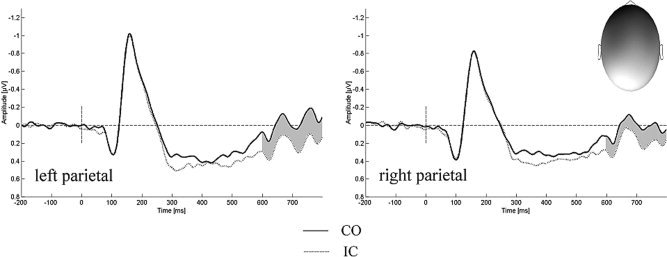
Interference effect over posterior brain regions. ERPs to congruent (CO) and incongruent (IC) stimuli aggregated over left‐ and right‐hemispheric electrodes (P3, P5, P7, PO3, PO7 vs. P4, P6, P8, PO4, PO8). The topography of the difference wave for the relevant time window (gray) can be seen in the upper right corner; dark colors indicate negativity whereas bright colors indicate positive amplitudes.