
Figure 1.
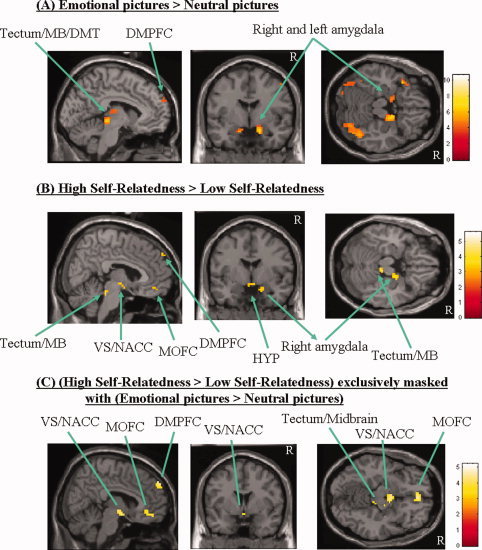
Signal intensities during emotional perception and self‐relatedness. (A) The signal intensities during emotional perception when compared (categorical comparison of conditions) with perception of neutral pictures. The sagittal view depicts the left hemisphere; the threshold of significance is set to P < 0.001 (uncorr), k > 10. See Supplementary Table I for exact coordinates. (B) The figure shows the signal intensities when one compares (categorical comparison of conditions) all (emotional and neutral) pictures rated as high self‐related with those rated as low self‐related. The sagittal view depicts the right hemisphere; the threshold of significance is set to P < 0.001 (uncorr), k > 10. See Supplementary Table I for exact coordinates. (C) The signal intensities when one exclusively masks the contrasts High self‐related pictures > Low self‐related pictures with the one Emotional pictures > Neutral pictures. The sagittal view depicts the right hemisphere; the threshold of significance is set to P < 0.001 (uncorr), k > 10 (the one for the mask was set to P < 0.05 (uncorr), k > 10). See Supplementary Table I for exact coordinates. Abbreviations: DMPFC, dorsomedial prefrontal cortex; MB, midbrain; MOFC, medial orbitofrontal cortex; HYP, hypothalamus; VS/NACC, ventral striatum/nucleus accumbens; DMT, dorsomedial thalamus; R, right; DMT, dorsomedial thalamus. [Color figure can be viewed in the online issue, which is available at www.interscience.wiley.com.]