
Figure 2.
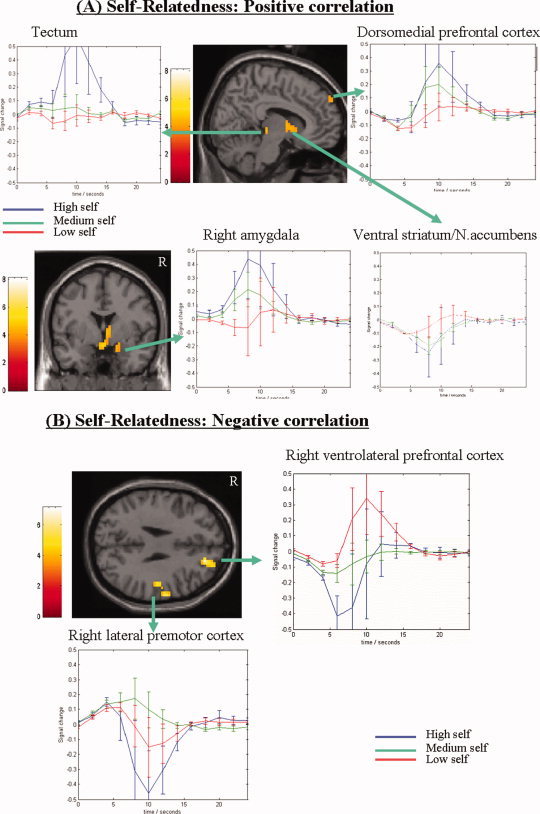
Signal intensities in positively (A) and negatively (B) correlating parametric maps of self‐relatedness. The image represents all regional signal intensities that correlate either positively (A) or negatively (B) with the degree of self‐relatedness (1–9 on visual analog scale) (see Supplementary Table II for exact coordinates). Subject‐specific partial correlation analysis of self‐relatedness was done at P < 0.001 uncorrected with extent threshold k = 10 voxels. The sagittal images depict the right hemisphere. The curves (x‐axis represent time and y‐axis signal percent change) demonstrate the BOLD‐signals for high (6–9 on visual analog scale; blue curve), medium (4–6 on visual analog scale, green curve), and low (1–3 on visual analog scale, red curve) self‐relatedness within each region. Abbreviations: R, right; DMPFC, dorsomedial prefrontal cortex; VLPFC, ventrolateral prefrontal cortex; VS/NACC, ventral striatum/nucleus accumbens. [Color figure can be viewed in the online issue, which is available at www.interscience.wiley.com.]