
Figure 4.
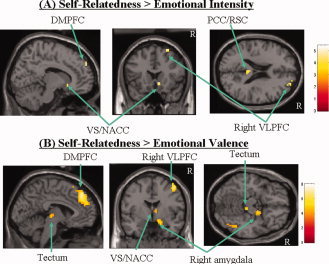
Comparison between parametric correlation maps of self‐relatedness and those of emotion dimensions. The figure shows the comparison of regions that parametrically correlate significantly stronger with the degree of self‐relatedness when compared with the ones for emotion dimensions like emotional intensity (A) and valence (B) (see Supplementary Table II for exact coordinates). Statistical comparisons (P < 0.001 uncorrected with extent threshold k = 10 voxels) were done on the basis of contrasts that relied on partial correlation analyses for all three regressors (self, valence, and intensity). The sagittal images depict the right hemisphere. [Color figure can be viewed in the online issue, which is available at www.interscience.wiley.com.]