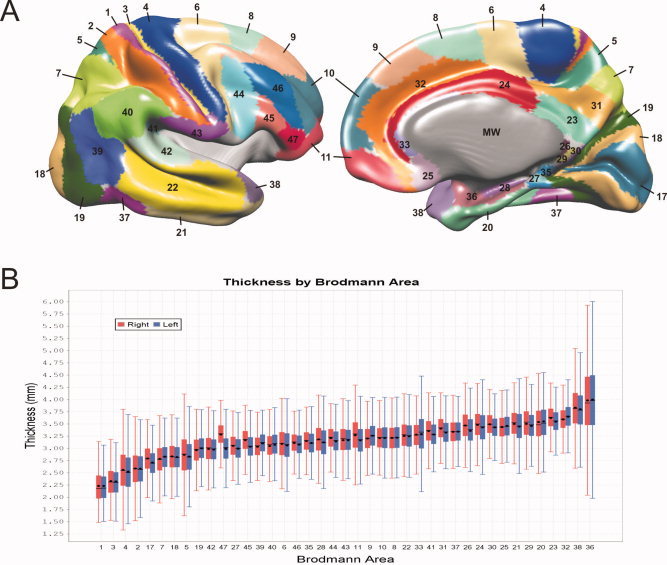
Figure 1.

Cortical grey matter regions of interest (GM ROIs). A: Parcellation of the cortical surface into Brodmann areas. Grey areas are not analyzed in the present study, and include the medial wall (MW), which is artificially created by the surface extraction process, and the insula region. B: Boxplots of Thickness for each Brodmann area ROI, showing the distributions for both hemispheres. ROIs are sorted by increasing mean Thickness. Filled boxes represent quartiles 1 to 3, capped lines indicate the range of regular values, circles indicate the mean, and horizontal lines indicate the median.
