
Figure 3.
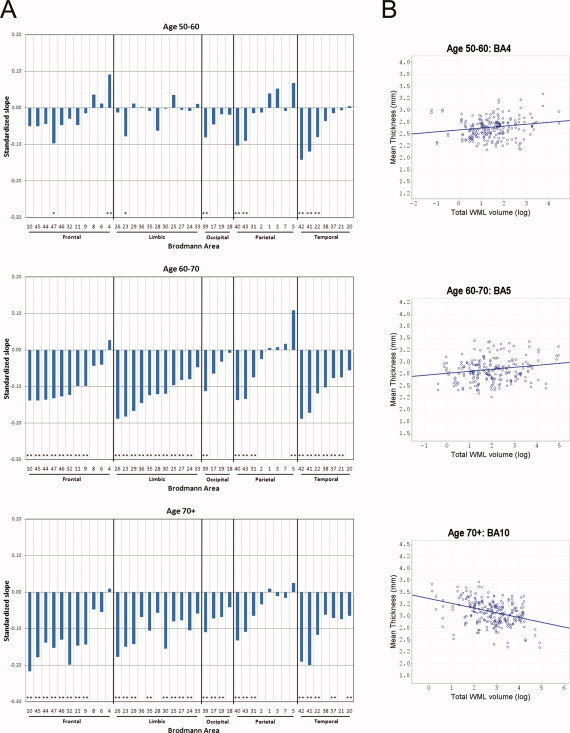
A: Bar plots showing the slope, standardized to the first‐order population statistics, for total WMLV in individual GM ROI‐wise linear regression models of the form Thickness ∼ log(WMLV). Analyses were performed over three age groups: 50–60, 60–70, and 70+. Model significance, accounting for FDR, is represented with asterisks (* indicates P < 0.05, q < 0.05; ** indicates P < 0.05, q < 0.01). For each lobe, BAs are sorted by the slope values from the 60–70 group. B: Selected scatterplots with linear regression lines for each age group, showing mean ROI‐wise cortical thickness versus log(WMLV) for BA4 and BA5 (positive), and BA10 (negative). [Color figure can be viewed in the online issue, which is available at wileyonlinelibrary.com.]