
Figure 1.
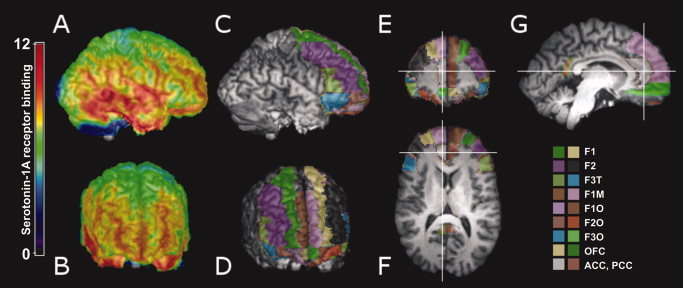
Exemplary parametric 5‐HT1A receptor binding potential map (A, B) and automated delineation of regions of interest (ROIs, C–G) drawn on an individual coregistered magnetic resonance image. F1, superior frontal cortex; F2, middle frontal cortex; F3T, triangular part of the inferior frontal cortex; F1M, medial part of the superior frontal cortex; F1O, orbital part of the superior frontal cortex; F2O, orbital part of the middle frontal cortex; F3O, orbital part of the inferior frontal cortex; OFC, orbitofrontal cortex; ACC, anterior cingulate cortex; PCC, posterior cingulate cortex. [Color figure can be viewed in the online issue, which is available at www.interscience.wiley.com.]