
Figure 2.
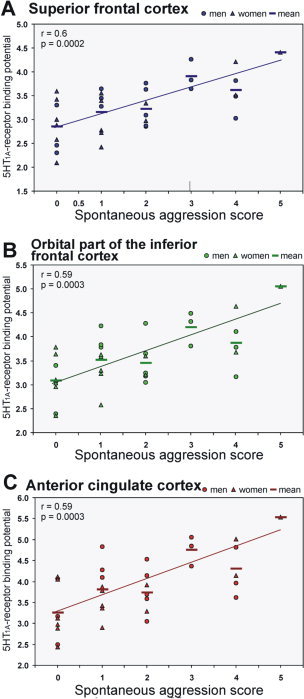
Correlations between the 5‐HT1A receptor binding potential and the “spontaneous aggression” component of the total aggression score in the frontal superior cortex (F1, A), in the orbital part of the frontal inferior cortex (F3O, B), and in the anterior cingulate cortex (ACC, C). Lines give regression fit, r and P values according to Spearman correlation coefficients triangles = women, circles = men, bars = means; n = 33. [Color figure can be viewed in the online issue, which is available at www.interscience.wiley.com.]