
Figure 5.
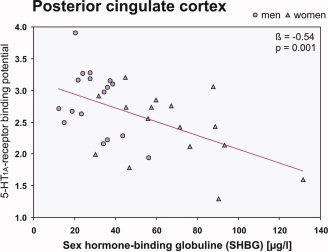
Inverse association between plasma levels of sex hormone‐binding globulin (SHBG) and the 5‐HT1A receptor BPNDs in the posterior cingulate cortex. Line gives regression fit, β and P values according to linear regression, triangles = women, circles = men; n = 33. [Color figure can be viewed in the online issue, which is available at www.interscience.wiley.com.]