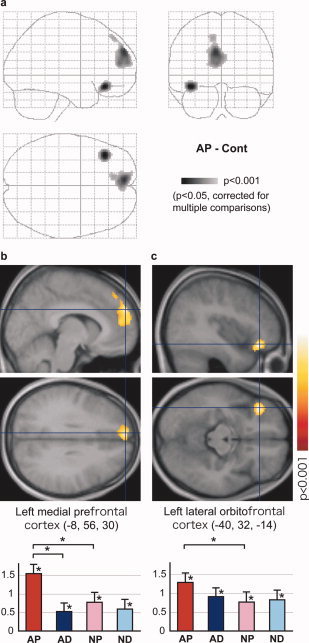
Figure 3.

Activation in the contrast: AP–Cont. (a) Glass brain presentation of SPM2; top‐left, top‐right, and bottom‐left panels show projections from the right, back, and top, respectively. The left medial prefrontal (b) and orbitofrontal (c) activations are superimposed on sagittal (top) and transaxial (bottom) sections of the mean image for the normalized T1‐weighted anatomical images of all subjects. The graphs show activation profiles (parameter estimates relative to the Cont condition and their standard deviations at peak activation). Asterisks at the bars and the lines at the top of the graph indicate significant (P < 0.05, paired t‐test) differential activation relative to the Cont condition and between conditions of interest (comparisons for simple effects only), respectively. Error bars indicate the standard errors of the mean.
