
Figure 4.
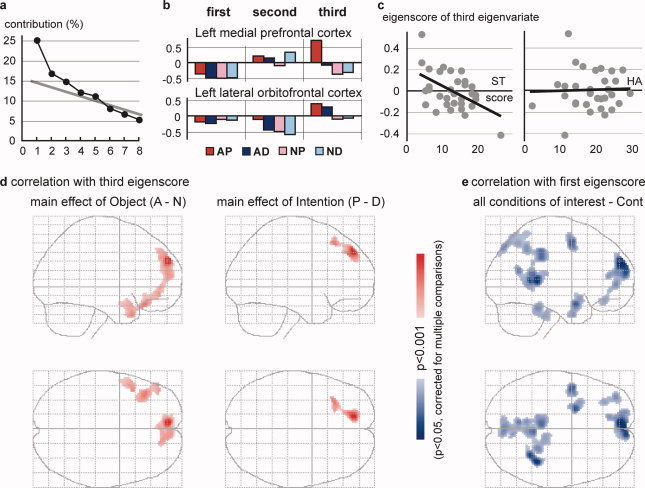
Results of PCA for intersubject variability of activation (relative to Cont) for the four conditions of interest in the two regions of interest (ROIs; the left medial prefrontal [−8, 56, 30] and lateral orbitofrontal [−40, 32, −14] cortices). (a) Results of the scree test. Three eigenvariates (principal components) were retained. (b) Eigenvector (loadings) of the four conditions for the two ROIs. (c) Plots of the third eigenscores against the ST and HA scores of the TCI for all subjects. The regression lines are shown. (d) Significant correlations (slope of the regression line) between the third eigenscores and the differential activations of the contrasts A–N (left panel) and P–D (right panel). (e) Significant correlations between the first eigenscores and the mean activation of all conditions of interest (relative to Cont). Cortical areas showing significant correlations are shown in a glass brain presentation (see legend for Fig. 3a).