
Figure 3.
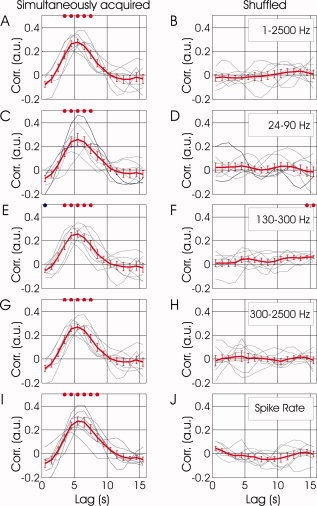
Covariation between spontaneous fluctuations in fMRI and neuronal signals as a function of temporal lag. (A) The grey curves show the correlation as a function of lag from each experiment. The red curve presents the correlation function averaged over seven experiments in five different monkeys (mean ± SEM). The vertical axis represents the Spearman's correlation coefficient between BOLD and the fluctuations in relative (fractional change) power averaged over frequencies of the denoised broadband neurophysiological signal acquired simultaneously with fMRI. The horizontal axis represents the lag between the two correlated signals, with positive lags standing for BOLD lagging behind the neuronal activity. (B) Correlation between the same signals as presented in (A), computed after breaking the simultaneity condition by shuffling the segments of BOLD and neuronal activity obtained within each experiment. (C‐D, E‐F, G‐H) present correlation functions in the format used for (A) and (B), for the LFP γ, mid‐range, and MUA bands, respectively. (I) and (J) present similar correlation functions for fluctuations in spiking activity, estimated by counting identified action potentials over 1s epochs rather than using frequency‐based analysis.