
Figure 2.
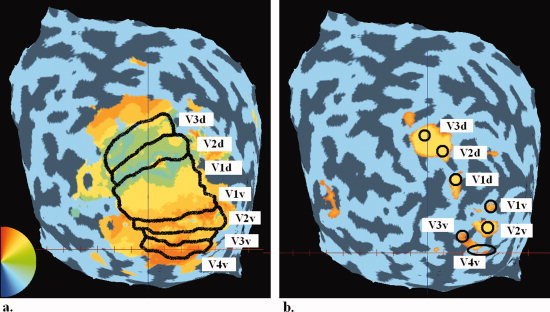
(a) A typical retinotopic map of the flattened left hemisphere occipital pole for one subject is shown with the approximate borders between the retinotopic areas specified in black. Retinotopic area masks were individually specified for each hemisphere of each subject. Blue here represents the lower vertical meridian, cyan/green the horizontal meridian, and red the vertical meridian. (b) The sub‐areas within the retinotopy that correspond to the to‐be‐filled‐in areas (the center of the four blue disks in the four quadrants). [Color figure can be viewed in the online issue, which is available at wileyonlinelibrary.com.]