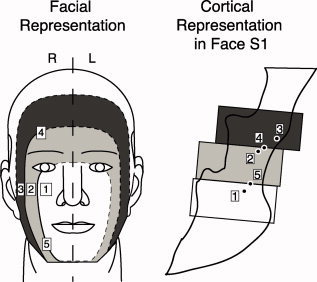
Figure 5.

Schematic segmental representation of the face observed in S1. Brushing of different facial sites produced activation with foci that supports the segmental organization of face representation in S1. The black/white dots represent positive activation foci identified for each stimulation site for the group. Dashed lines in the concentric ovals indicate putative extrapolated segmental boundaries.
