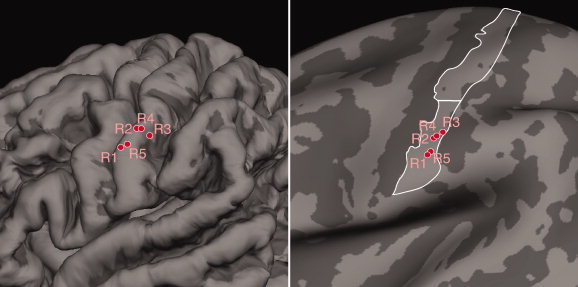
Figure 6.

Localization of activation foci on the averaged brain. The image on the left portrays the pial surface of the average brain (n = 12 subjects) reconstructed using Freesurfer (Fischl et al., 1999), to highlight the three‐dimensional gyral and sulcal patterns. Foci and labels colored red indicate positive activation maxima. The image on the right is the inflated surface of the average brain.
