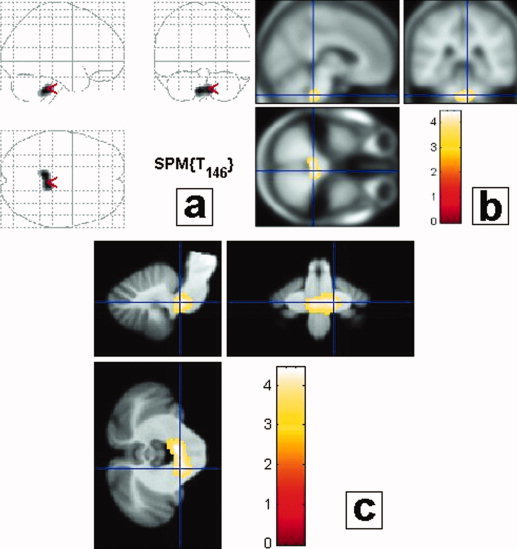
Figure 2.

Group analysis: Subjects with severe SRBDs (ODI ≥ 15) versus non‐SRBDs (ODI < 15). Subjects were categorized in two groups, those with severe SRBDs, as defined by ODI ≥ 15 and those without SRBDs (ODI < 15). Results are displayed with a P < 0.05 threshold, corrected for multiple comparisons, at the cluster level (Table II). Gray matter loss in the group of subjects with SRBDs compared to those without SRBDs concerned the middle/inferior part of the lower pontine/upper medulla area. Results are presented in neurological convention (i.e., left side of the brain is on the left side of the figure). (a) Projections map (SPM2) showing a gray matter decrease only in the brainstem. (b) Maximum of correlation between gray matter loss and ODI. Note that the cluster is extended in the upper medulla/inferior pontine region, close to the ventricular surface, bilaterally, symmetrically; in a localization consistent with the intermediate reticular zone of the bulbopontine area (Table II). The clusters are projected onto the specific template performed for this study from the 61 averaged subjects with normal MRI. (c) Maximum of correlation between gray matter loss and ODI (same as b), projected onto the brainstem template from Diedrichsen [2006].
